Charts
Create Charts from Queries
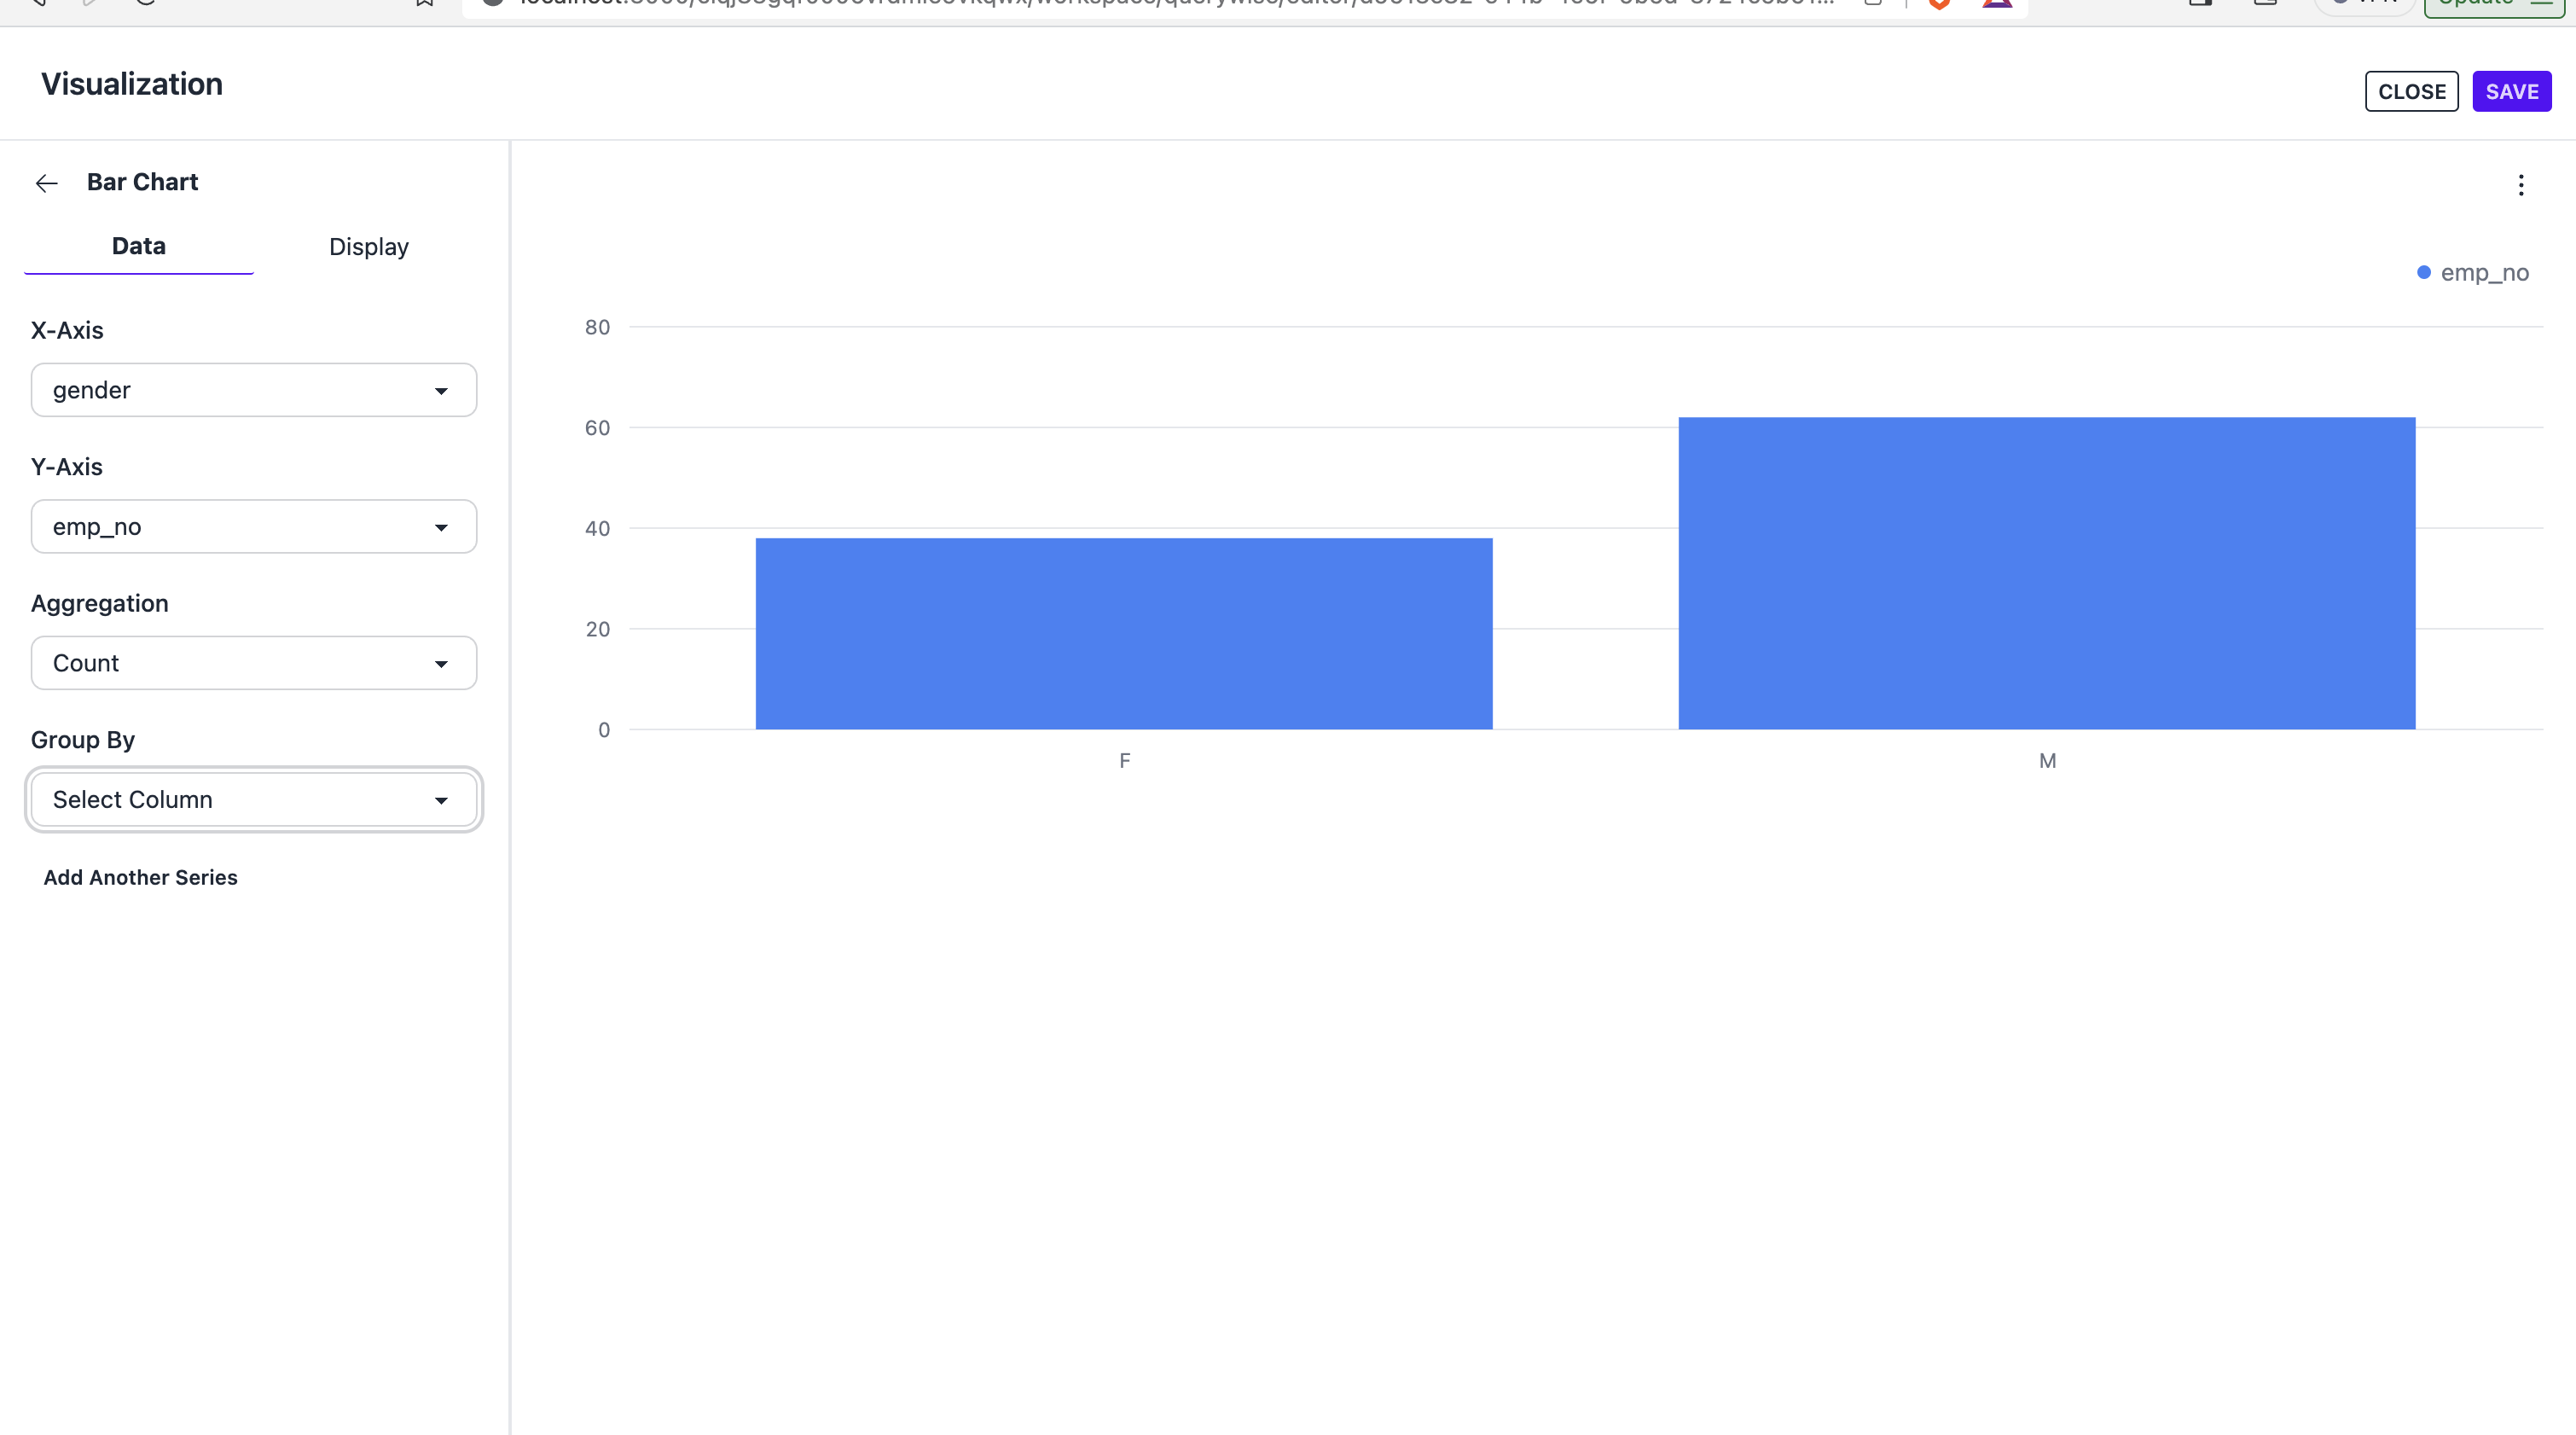
Querywise provides a powerful feature to create charts from your SQL queries. You can visualize your data in various forms such as:
- Bar Charts
- Line Charts
- Area Charts
- Scatter Plots
- Donut Charts
These charts can help you to understand your data better and make informed decisions. They are especially useful when dealing with large datasets where trends and patterns might not be immediately obvious.
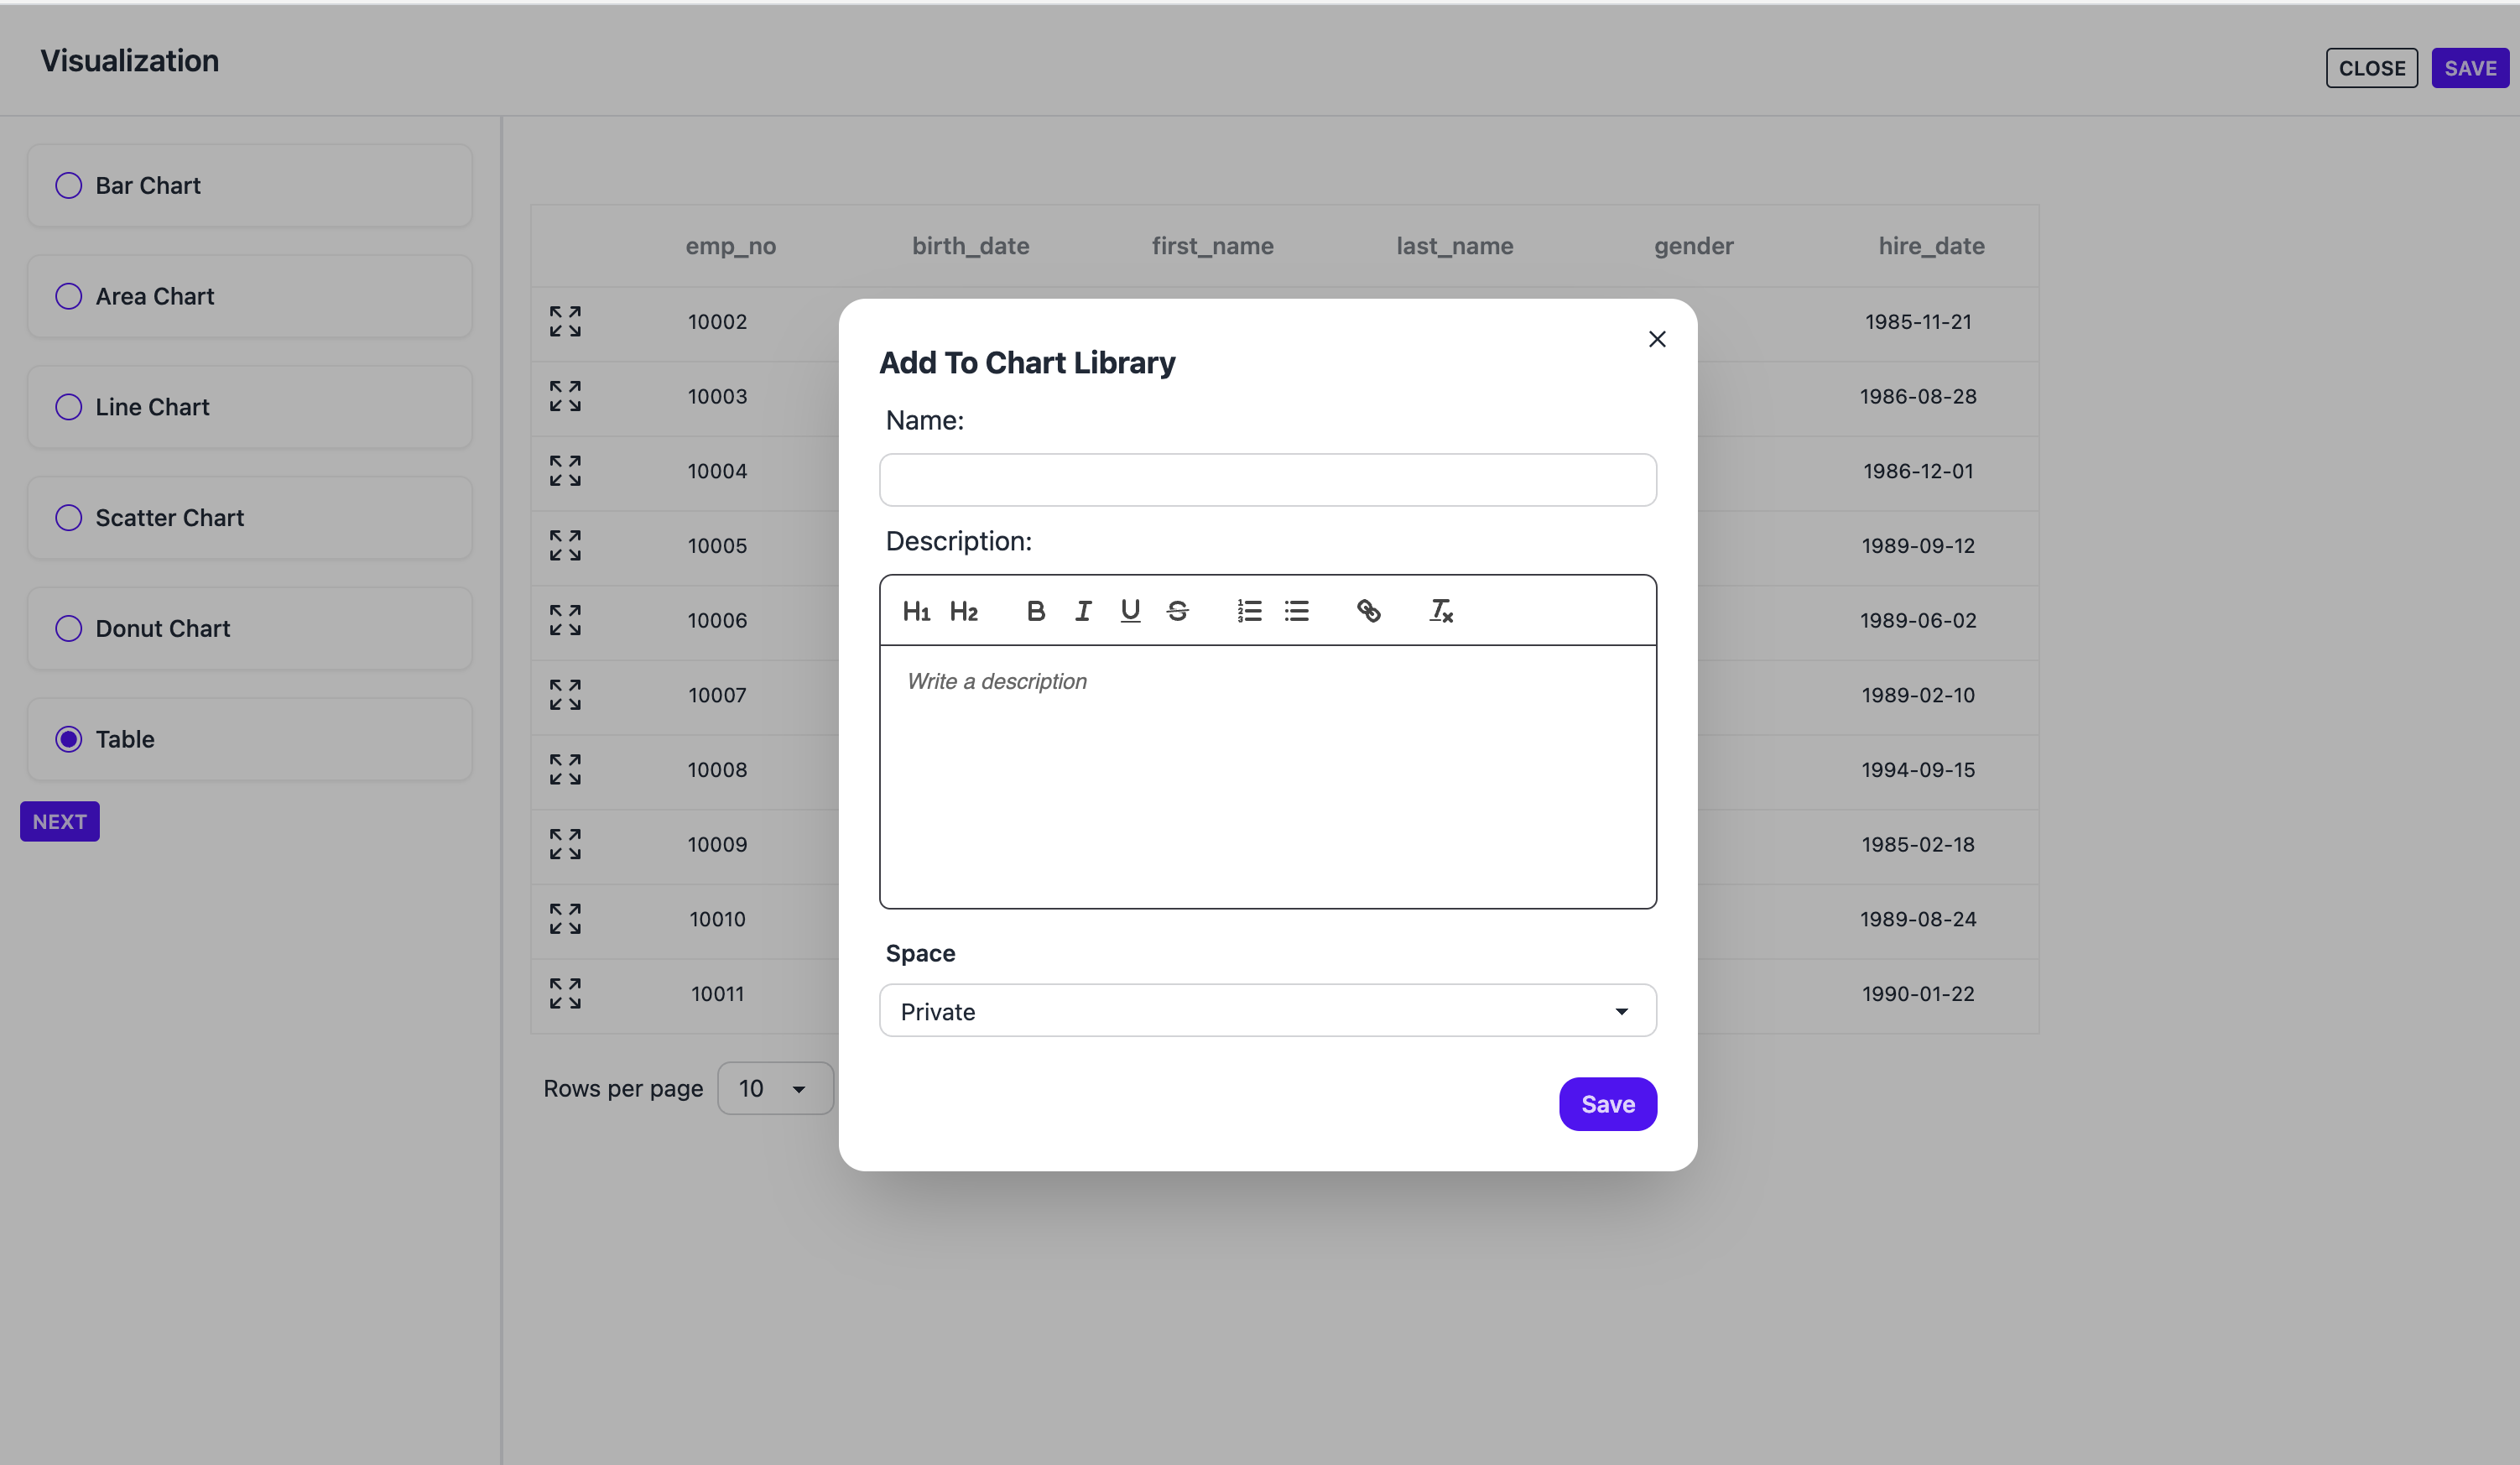
Save To Chart Library
Charts created in the SQL Editor can be saved in the chart library, which can then be imported into Reports.